Scientific Visualization
References & Resources:
- Andy Johnson's CS 491 - Visualization and Visual Analytics web site.
- Edward Tufte:
- "Visual Display of Quantitative Information, 2nd edition"
- "Envisioning Information"
- "Visual Explanations - Images and Quantities, Evidence and Narrative"
- Wikipedia: Scientific Visualization
- K.W. Brodlie, "Scientific Visualization: Techniques and Applications"
General Overview
- Engineers and Scientists generate overwhelming amounts of
data ( both measured and simulated ) which must be visualized
in some manner before it can be properly comprehended. The goal
of Scientific Visualization is to provide the scientist with
quick and accurate comprehension and insight into the scientific
phenomenon that lies behind the data.
- Related to scientific visualization is Information Visualization,
with the key difference being that the data being examined is
not scientific or technical in nature. ( For example, visualizing
the complete works of Shakespeare or the complete collections
of the National Archives to try and find important patterns in
the data. ) One of my favorite applications of information visualization
is the Interactive
Information Visualization of a Million Items project conducte
at the University of Maryland.
- One of the top conferences in the field of scientific visualization
is the IEEE Visualization conference. The web site for the IEEE VisWeek 2009 is available on-line. The proceedings can be found
via the IEEE Digital Library.
Classification of Scientific Visualization
There are many different ways to classify ( scientific ) information visualizations. One way is the dimensionality of the domain over which the data is defined, and the dimensionality of the data to be displayed at each location. Data can also be categorized as to whether it is continuous or categorical. For example:
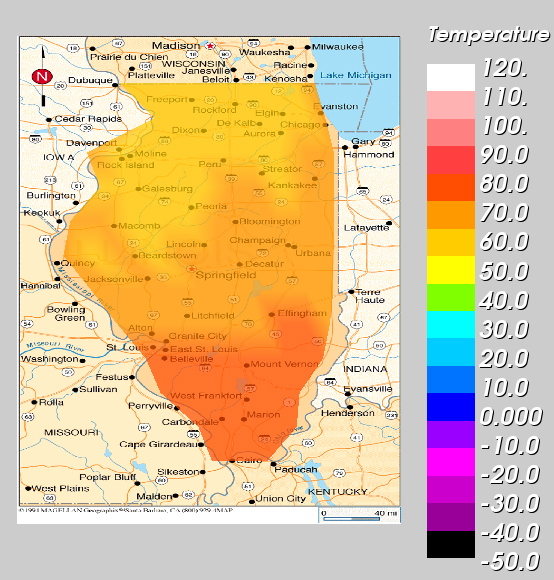
- A weather map is typical of a single data value defined over a two-dimensional domain:

- The following image shows a scalar value defined over a 2.5-dimensional domain, because the surface looks 3 dimensional but isn't really. ( Unless one wants to consider the height as another piece of displayed data, in which case this image displays two scalars over a 2-dimensional domain. )

- The next image shows three dimensional data displayed over a two-dimensional domain:

- There are several good ways to display scalar data defined over a three-dimensional domain:


Here is an example of a single icon illustrating 4 values, independant of its position in 3-D space. Color indicates termperature, height indicates volume, shape indicates pressure, and sound indicates entropy.

- Here is an example of a very large amount of data displayed over what is arguably a one-dimensional domain. ( This image shows temperature, pressure, liquid & vapor flowrates, and liquid & vapor compositions on each stage of a distillation tower, along with heating and cooling duties and the flowrates and compositions of all entering and leaving streams. )

